What Is a Good D2C Conversion Rate in India?
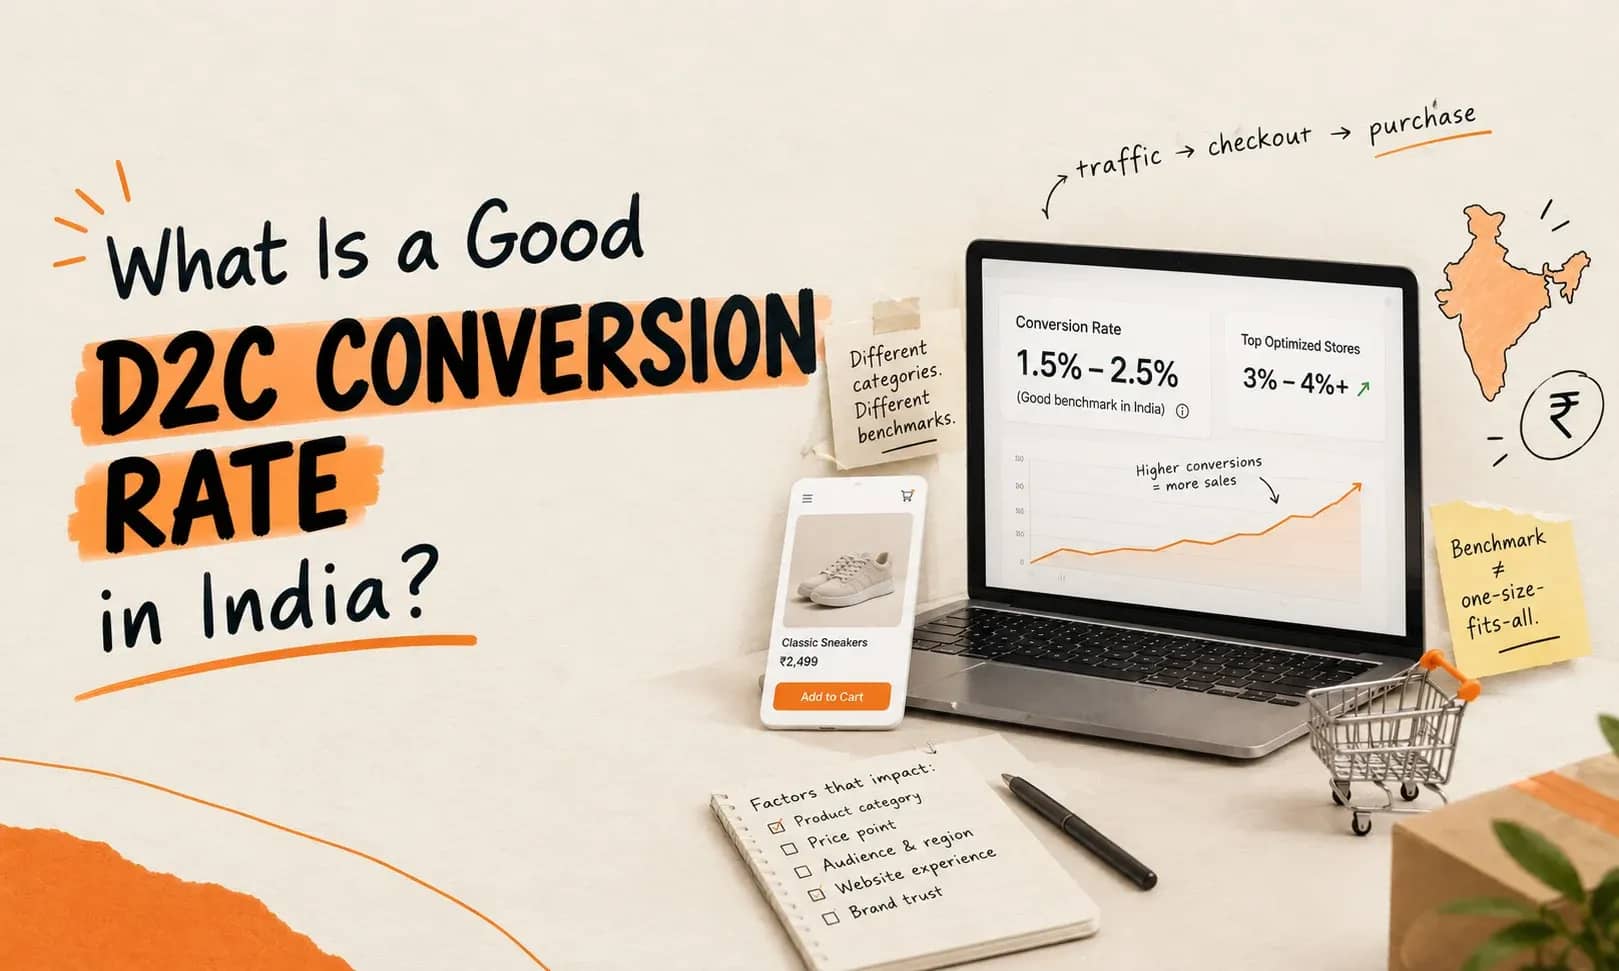
“Is 1.8% good or bad?” is one of the most common questions a D2C founder asks after their first few months of real traffic – and it’s genuinely hard to answer without more context, because published D2C conversion rate benchmarks vary depending on whether they’re measuring mean or median, blended or traffic-source-specific, and global or India-specific data.
For an Indian D2C brand, an overall D2C conversion rate in the 1.5-2.5% range is a reasonable working benchmark for an established store, with top-performing, well-optimised stores reaching 3-5%. But the single number that matters far less than most founders think – traffic source explains most of the variation: branded search and email traffic commonly convert in the 4-8% range, while cold paid social traffic often converts under 2%, sometimes closer to 1%. A blended average that mixes both tells you less than looking at each D2C conversion rate by source separately.
Why India’s average sits below the US and Europe
Indian D2C ecommerce carries structural friction that mature markets like the US have largely resolved: heavier reliance on cash-on-delivery (which introduces a second decision point at the door, separate from the online “add to cart” decision), a majority-mobile traffic base with more checkout friction than desktop, and comparatively newer trust infrastructure for online payments in certain categories. These aren’t permanent ceilings they’re closing as UPI adoption, prepaid incentives, and mobile UX all improve but they’re real, structural reasons an India-specific benchmark should sit somewhat below equivalent US or European figures rather than being compared to them directly.
The mean-vs-median trap in every conversion benchmark you’ll read
Most published “average conversion rate” figures are means, and means get pulled upward by a small number of very high-converting stores (typically low-priced, impulse-purchase categories) sitting alongside a much larger number of stores converting well below that average. A median the conversion rate of the “middle” store in a dataset is typically meaningfully lower than the mean for exactly this reason. If a founder benchmarks their 1.3% conversion rate against a mean of 1.8–2%, they may conclude they’re underperforming, when in reality they may be sitting right around the median for their category. Ask what a benchmark is measuring mean or median before using it to judge your own number.
Conversion rate by traffic source: the number that actually matters
| Traffic source | Typical conversion range | Why |
| Branded search / direct | 4–8% | Visitor already knows the brand and has high purchase intent |
| Email (existing subscribers) | 3–6% | Warm audience, often segmented by purchase history or intent |
| Organic search (non-branded) | 2–4% | Mixed intent some research-stage, some closer to purchase |
| Retargeting (Meta/Google display) | 1.5–3% | Visitor already showed interest once; friction is usually price or trust, not awareness |
| Cold paid social (Meta/Instagram) | 0.8–2% | Visitor didn’t ask to see this; awareness and trust are being built in the same session as the purchase decision |
| Influencer-driven traffic | Highly variable, often 1–3% | Depends heavily on audience-brand fit see influencer ROI measurement for the deeper breakdown |
A brand looking only at its blended site-wide conversion rate can miss that its email channel is performing excellently while its cold social spend is dragging the average down or vice versa. Diagnosing by source, not just by the headline number, is what actually points toward a fix.
What actually moves conversion rate, in rough order of typical impact
1. Price-to-value clarity on the product page. Confusing or unjustified pricing (no clear reason why this product costs what it costs, relative to visible alternatives) is one of the most common, most fixable conversion blockers and one of the cheapest to test.
2. Checkout friction, especially on mobile. With mobile traffic making up the large majority of Indian D2C sessions, every extra form field, every slow-loading step, and every moment of ambiguity about COD vs. prepaid options costs real conversion. Auto-fill, saved address options, and a visibly short checkout flow measurably reduce abandonment.
3. Trust signals matched to the actual objection. Generic trust badges help less than addressing the specific hesitation a category faces a return policy prominently shown for a fashion brand (where fit uncertainty is the real objection), or verified reviews with photos for a category where product-authenticity concern is common.
4. COD vs. prepaid incentive structure. A meaningful prepaid discount or free-shipping-on-prepaid incentive shifts order mix toward prepaid, which not only affects conversion behaviour but also reduces the downstream RTO (return-to-origin) losses that COD-heavy order books carry.
5. Page speed, particularly on mobile networks outside metro-tier connectivity. A store that loads acceptably fast in a Bengaluru office on wifi can load meaningfully slower on a typical mobile connection elsewhere and speed has a well-established, direct relationship with conversion, independent of everything else on the page.
A practical benchmarking exercise for your own store
- Pull conversion rate by traffic source for the last 90 days, not just the blended site-wide number.
- Compare each source against the source-specific range above, not a single blended benchmark.
- Identify which source is furthest below its typical range that’s usually the highest-leverage place to investigate first, rather than spreading optimization effort evenly across the whole funnel.
- Re-run this quarterly, since traffic mix shifts (a successful influencer push, a new paid channel) can move the blended average without any actual change in on-site conversion behaviour.
Mistakes in how founders interpret their own conversion rate
Comparing blended conversion rate against a single “good D2C conversion rate” number found online, without knowing whether that number is a mean or median, global or India-specific, or blended across all traffic sources.
Chasing conversion rate improvements on the wrong traffic source. Optimising checkout flow when the real drag is unqualified cold traffic (visitors who were never likely to convert regardless of checkout quality) wastes CRO effort on the wrong lever.
Ignoring category context entirely. A considered-purchase category (furniture, high-value electronics, jewellery) will structurally convert lower than an impulse-purchase category (snacks, accessories, low-cost beauty) comparing the two against the same benchmark number is comparing different kinds of buying decisions.
FAQs
A reasonable working range is 1.5–2.5% for an established store, with top-performing, well-optimised stores reaching 3–5% but this varies significantly by category and average order value.
Global averages typically include markets with more mature payment trust infrastructure and lower COD reliance than India’s typical D2C order mix an India-specific, source-segmented comparison is more useful than a global blended figure.
The median, where available means are frequently pulled upward by a small number of very high-converting, low-price, impulse-purchase stores, which can make a genuinely reasonable conversion rate look artificially low by comparison.
Not on its own conversion rate needs to be read alongside average order value, margin, and traffic volume. A very high conversion rate on very low traffic can still mean an unsustainable business.
Cold social visitors didn’t seek out the product brand trust and purchase intent both have to be built within the same browsing session, unlike search traffic, where intent typically already exists before the click.